Moving Industry Statistics

According to US Census data, 8.4% of Americans moved in 2021. That’s roughly 28 million people representing $19 billion dollars of annual spending on moving services.
To better grasp how much the moving industry affects just about everything, we’ve compiled some of the most thought-provoking moving industry statistics of 2021 and 2022.
General moving industry statistics
- The average American moves 11.7 times in their lifetime. [1]
- According to new Census data, nearly 28 million people — or 8.4% of all Americans — moved in the United States in 2021. [2]
- Based on the latest Annual Social and Economic Supplement (ASEC) data, 17.29% of those moves were state-to-state, which means that approximately 4.8 million Americans made interstate moves in 2021. [3]
- While 8.4% of all Americans moving may seem like a lot, it’s actually the lowest number of moves since the Census Bureau started tracking moving data in 1948. [2]
- Today, about half as many people move each year as they did in the 1950s. [4]
How much does moving cost?
We crunch the numbers for both local and long-distance moves: [5] Local moving costs
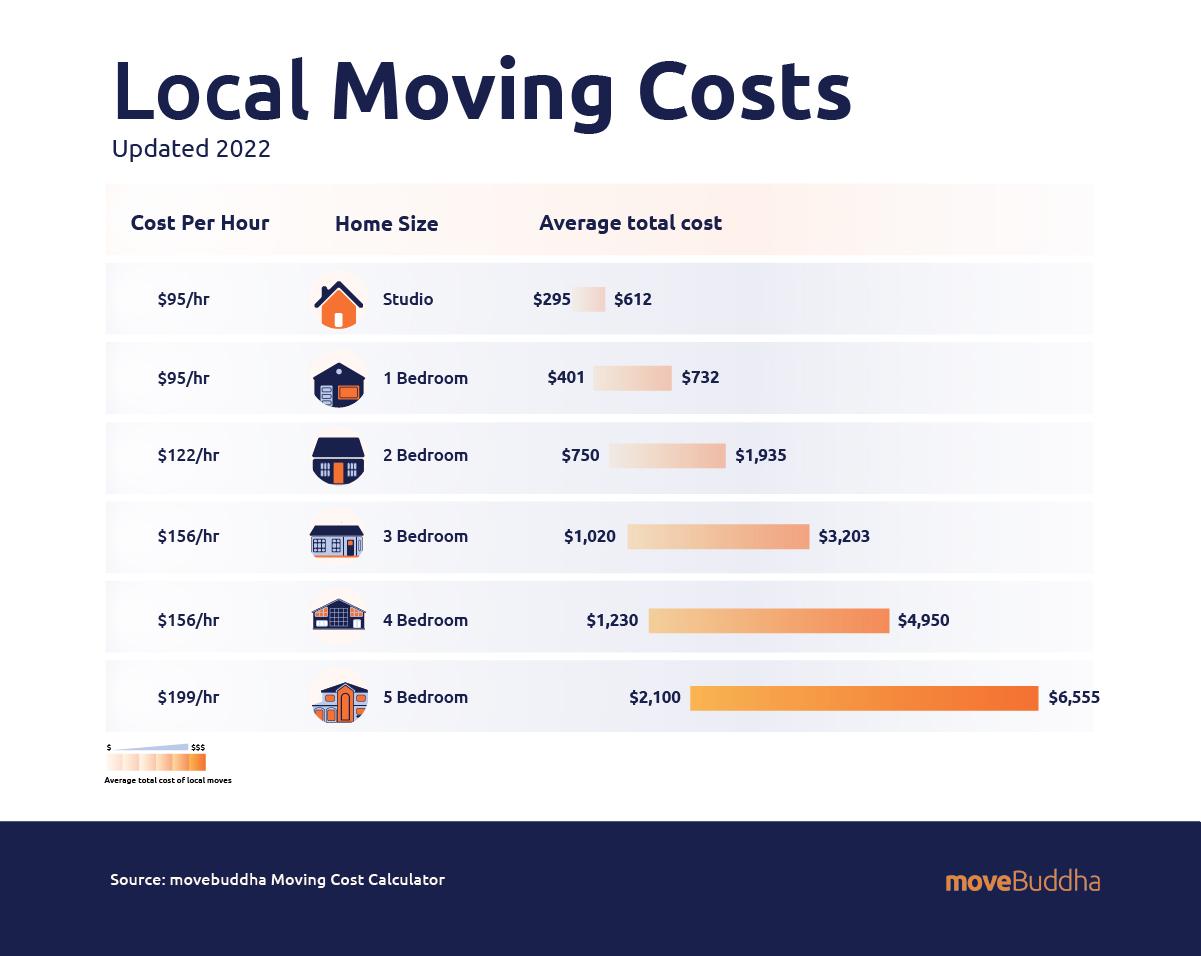
- Local moving companies charge by the hour, with rates ranging from $65 up to $250 per hour.
- Depending on the size of the move, hiring professional movers for a local move will cost on average anywhere from $300 to $3,500.
Long-distance moving costs
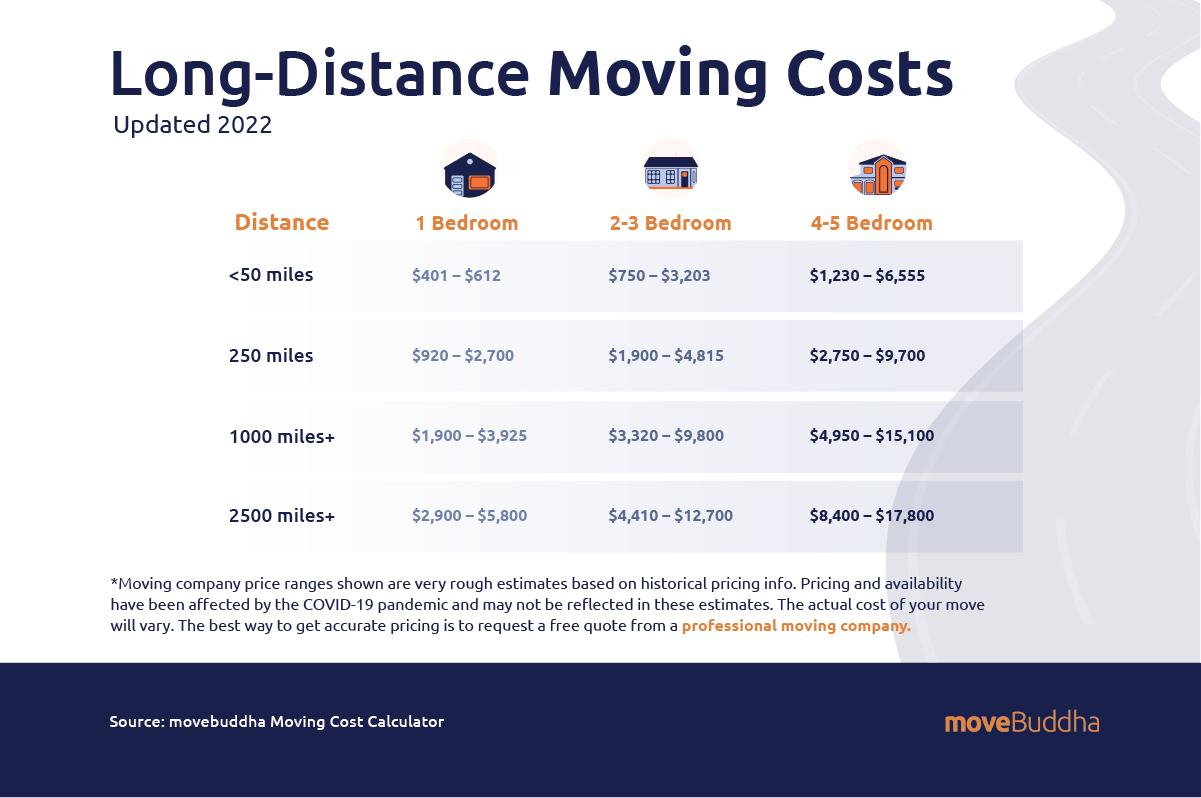
- With long-distance moving companies charging by weight, prices can range from $2,500 to $11,600, depending on the size of the move and the distance.
Related: Moving Cost Calculator
The logistics of moving
How people move
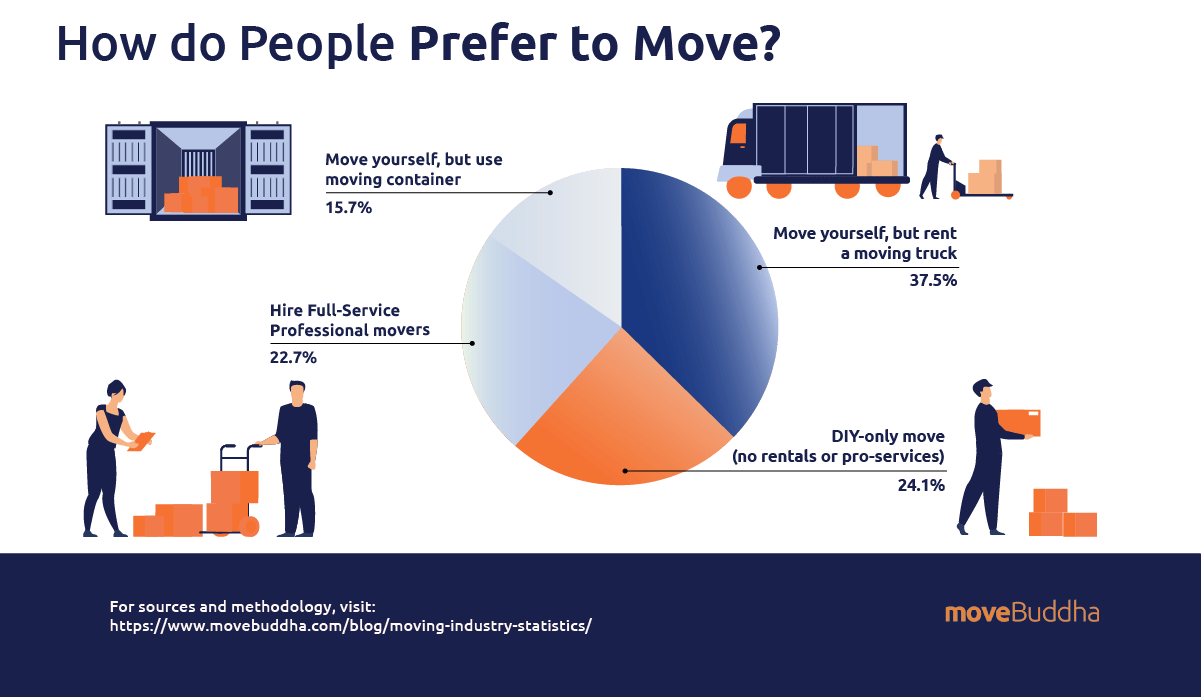
moveBuddha conducted a Google Survey of 1,500 people in the U.S. asking, “If you have moved or were to move homes, how would you choose to move?” The responses are as follows:
- Move yourself, but rent a moving truck: 37.5%
- DIY-only move (no rentals or pro-services): 24.1%
- Hire Full-Service Professional movers: 22.7%
- Move yourself, but use moving containers: 15.7%
Related: Best Moving Container Companies
When people move
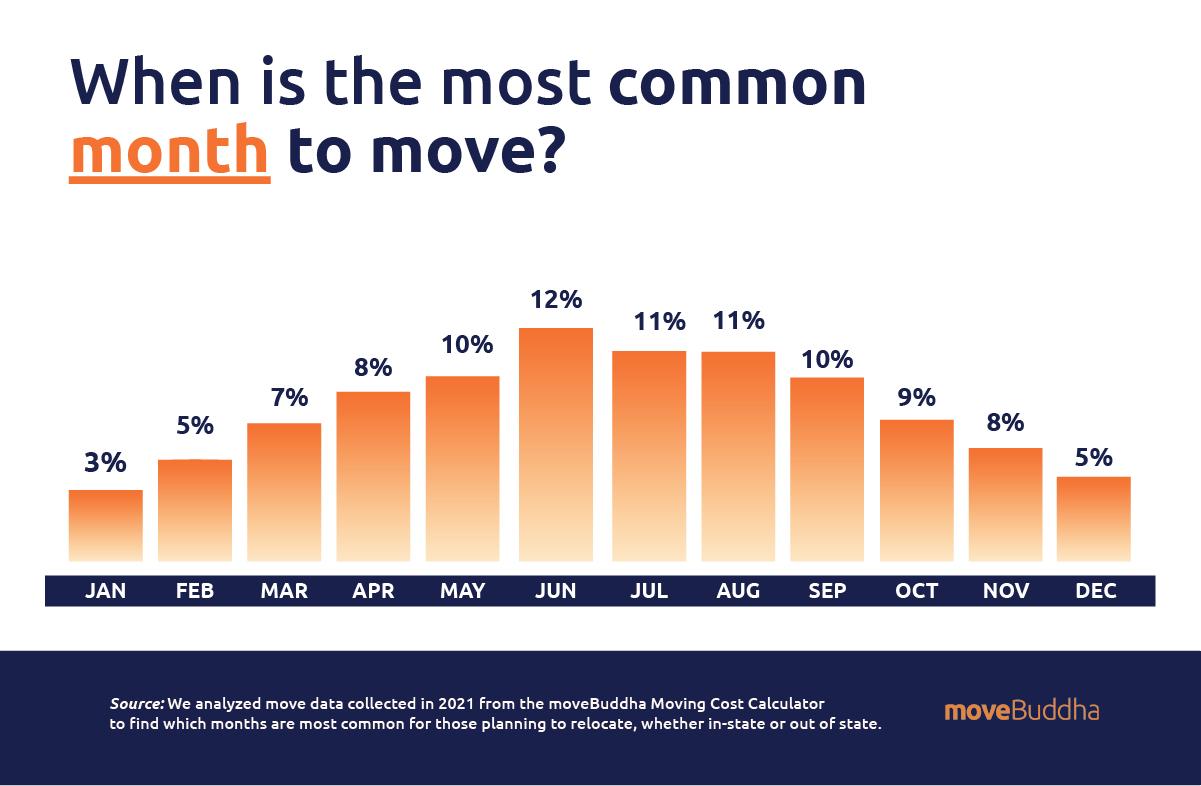
- June is typically the most common month of the year to move.
- Summer is by far the busiest time of year to move, with nearly 45% of annual U.S. moves taking place between May and August. [6]
- The busiest dates to move are June 1st and 30th, while September 1st and 30th come in slightly behind. [6]
- Here’s the breakdown for the total percentage of moves that happen in each month of the calendar year: [6]
When is the most common day of the week to move?
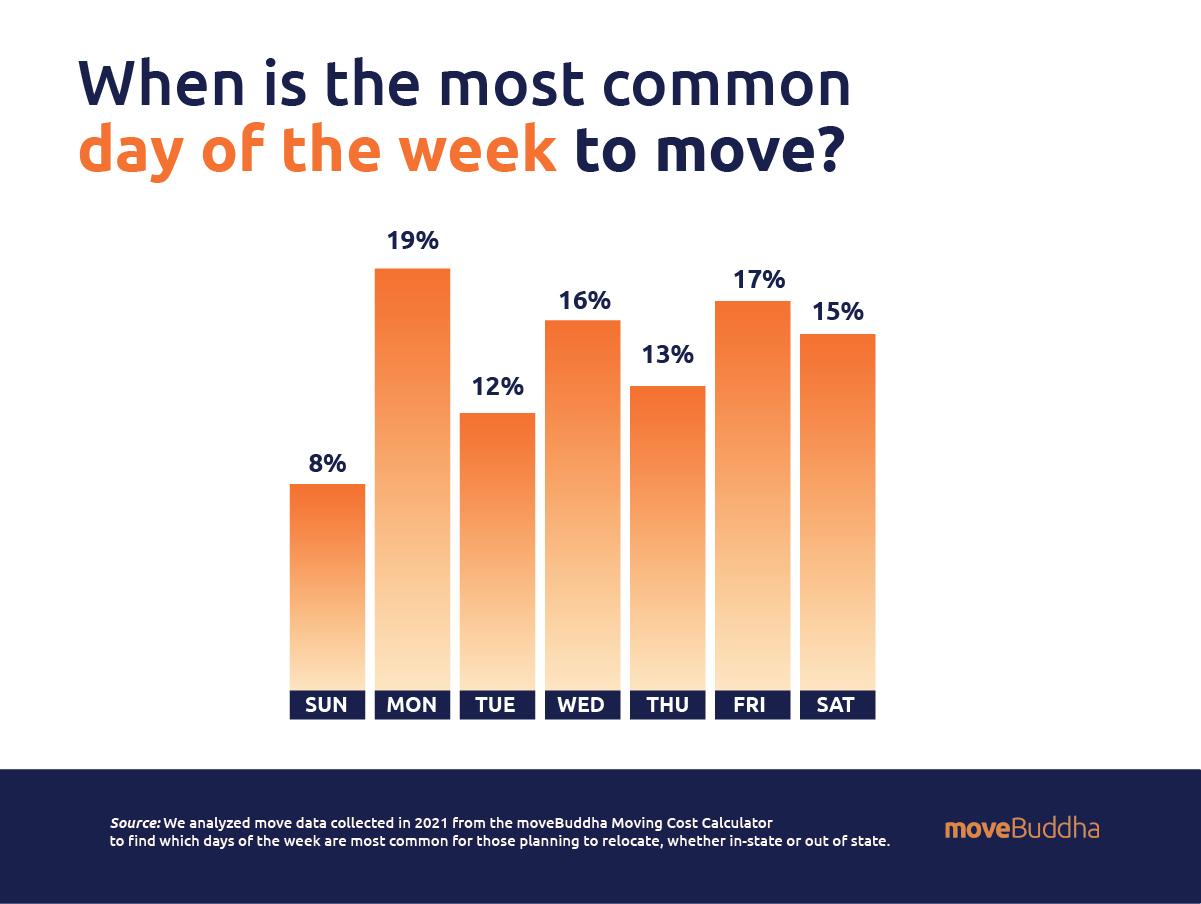
Mondays are the most common day of the week to move with 19% of moves taking place on Mondays.
- Sunday 8%
- Monday 19%
- Tuesday 12%
- Wednesday 16%
- Thursday 13%
- Friday 17%
- Saturday 15%
And while we know that weekends are often considered the most popular time for people to move, here’s the percentage of moves scheduled by day of the week: [6]
Where people move
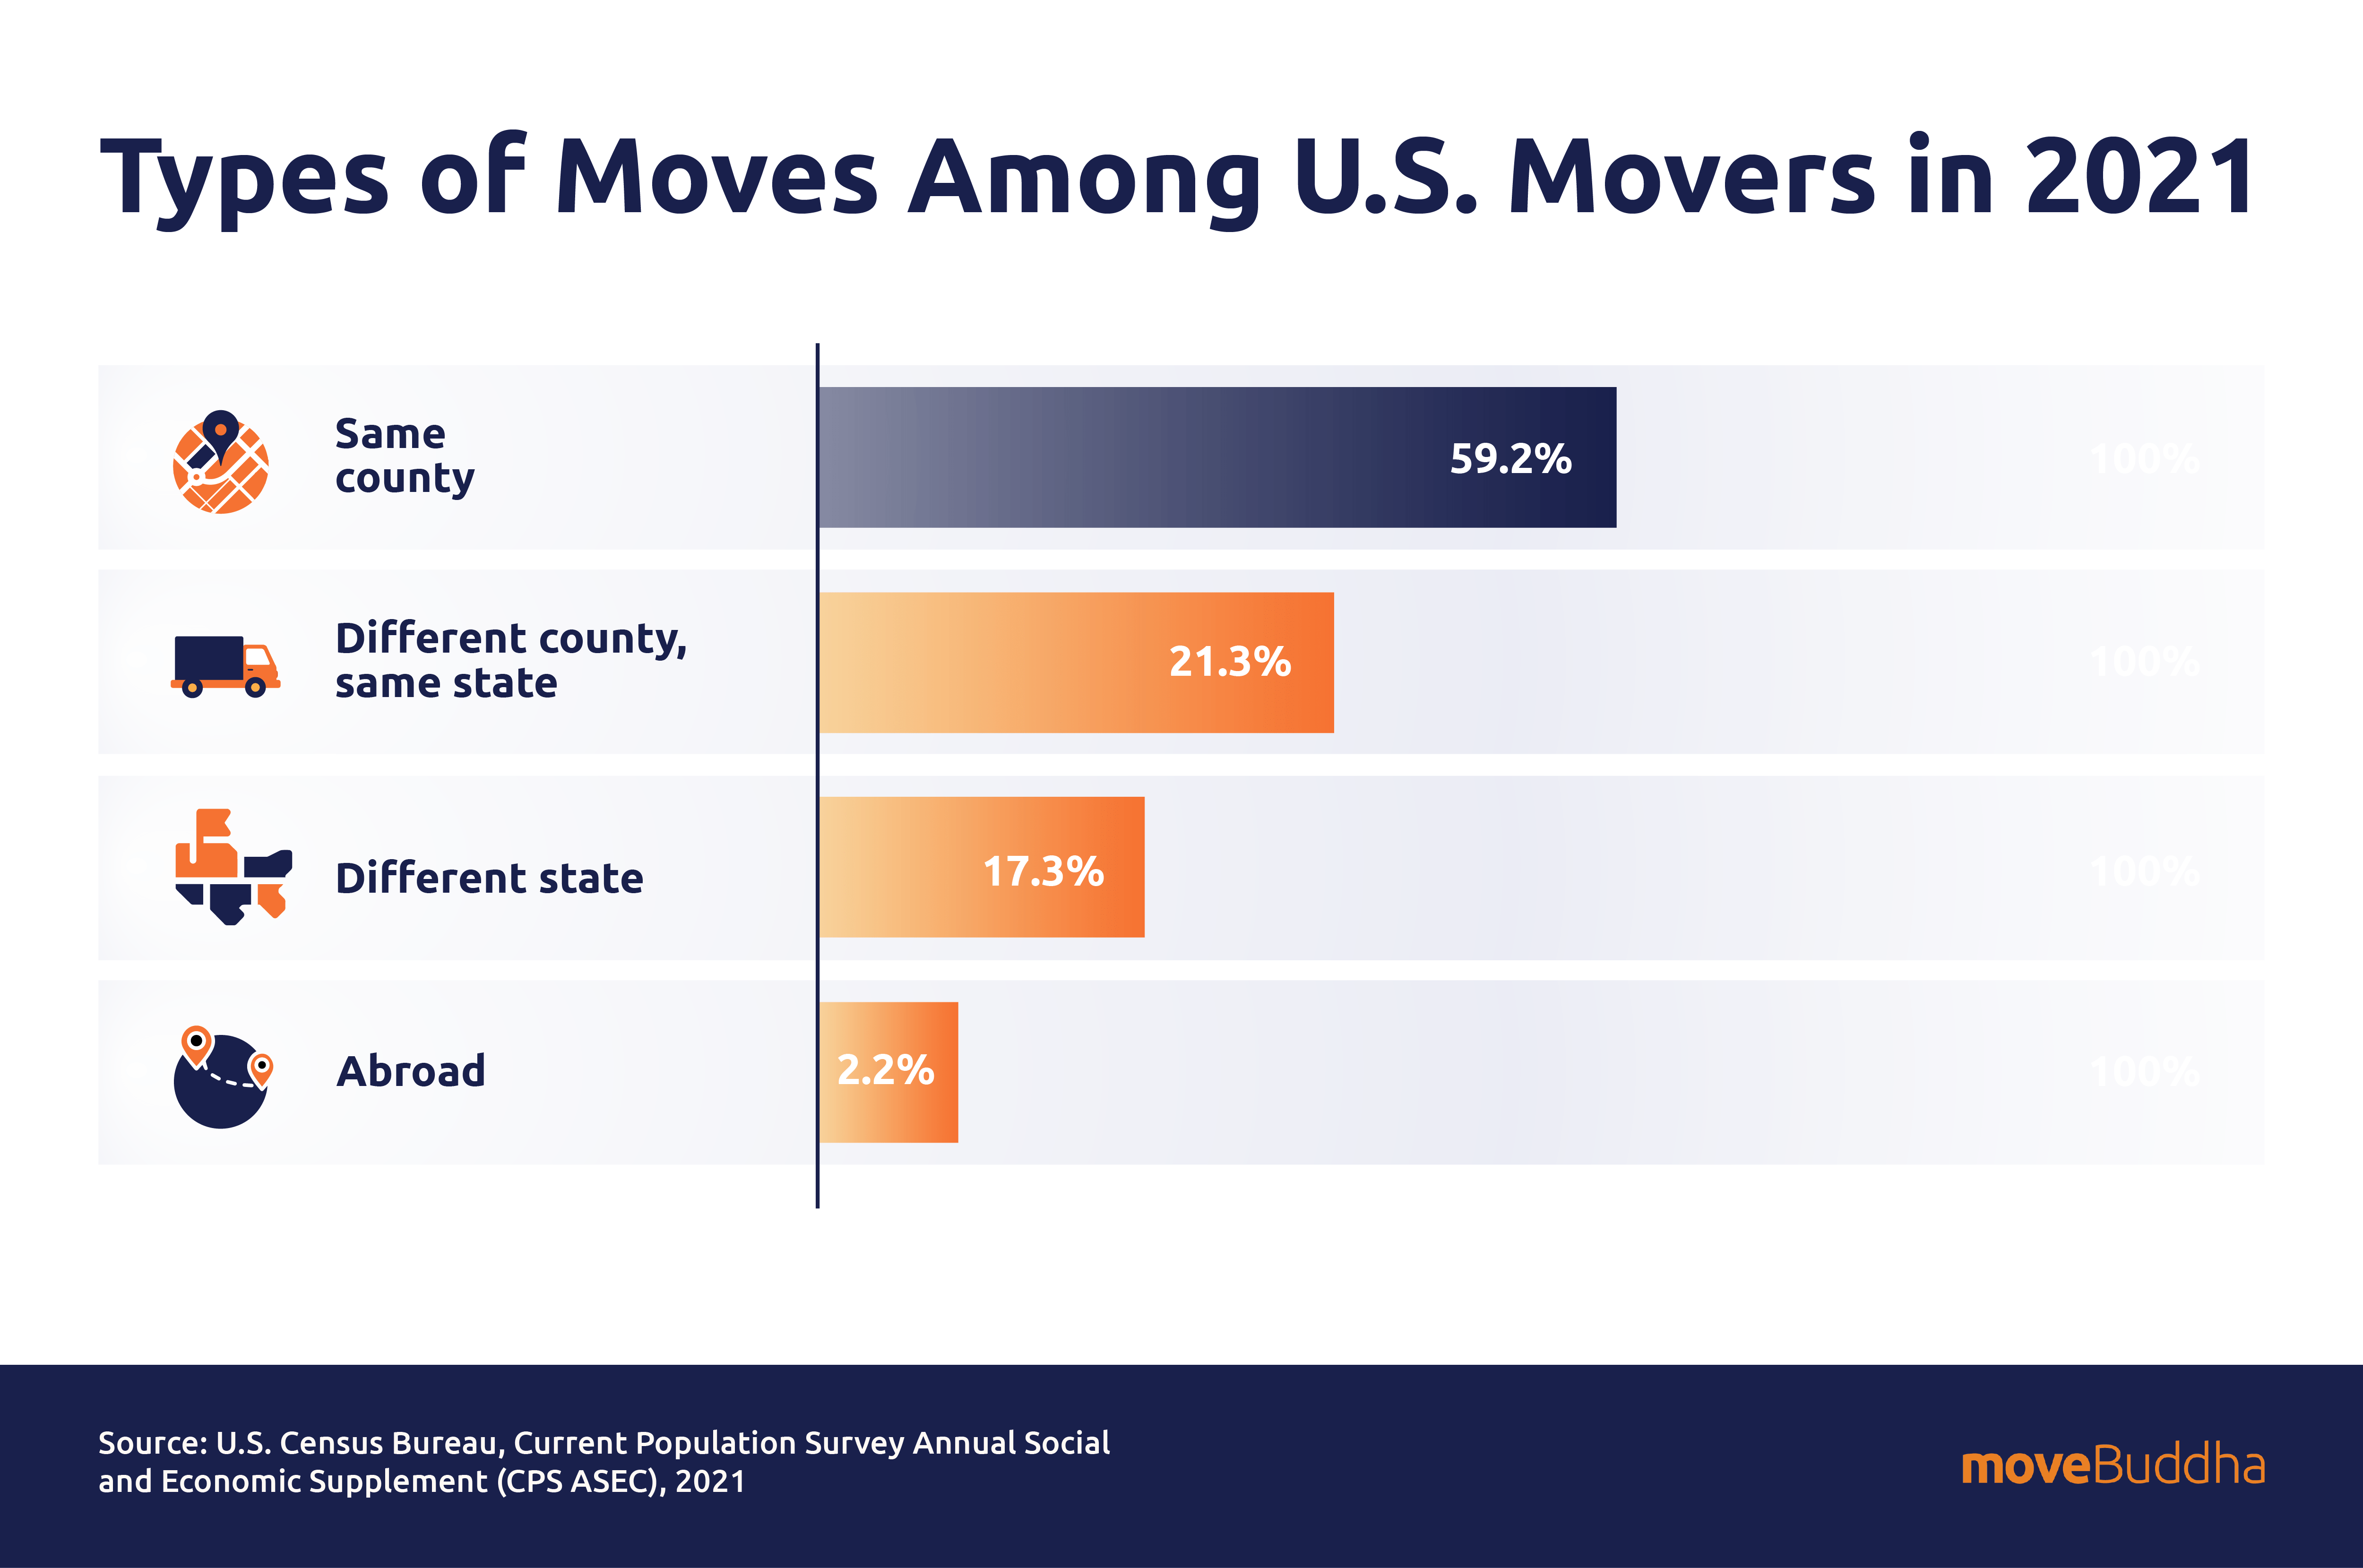
- Over half of all 2021 moves were in the same county, and roughly 80% of movers stayed within the same state: [3]
- 59.17% moved within the same county (same state).
- 21.3% moved to a different county (same state).
- 17.29% moved to a different state.
- 2.24% moved to a different country.
-
- When analyzing the number of miles traveled, we found that the average distance moved in 2021 was 922 miles. With an upswing in interstate moves last year, we’re seeing more people relocating farther distances. Here’s the full breakdown: [6]
- 28.5% moved 1-100 miles
- 4.1% moved 100-500 miles
- 16% moved 500-1,000 miles
- 23.7% moved 1,000-2,000 miles
- 17.7% moved 2,000+ miles
- When analyzing the number of miles traveled, we found that the average distance moved in 2021 was 922 miles. With an upswing in interstate moves last year, we’re seeing more people relocating farther distances. Here’s the full breakdown: [6]
Related: Best Interstate Moving Companies
- Looking only at interstate moves, people who relocate the furthest distances are moving from: [6]
- Alaska: 3,727 miles
- Hawaii: 3,590 miles
- Washington: 2,042
- Meanwhile, those relocating the shortest distances are moving from: [6]
- West Virginia: 878 miles
- Delaware: 892 miles
- Mississippi: 915 miles
- The busiest state-to-state moving routes according to 2021 data are between these states, 4 of which originate from California: [6]
| Rank | Busiest state-to-state moving routes |
| 1 | California to Texas |
| 2 | California to New York |
| 3 | New York to Florida |
| 4 | California to Florida |
| 5 | California to Washington |
| 6 | New York to California |
What states are people moving to?
What was the most moved to state in 2020?
- That distinction goes to Florida, with a net domestic migration gain of 220,890. [7]
What was the most moved to state in 2021?
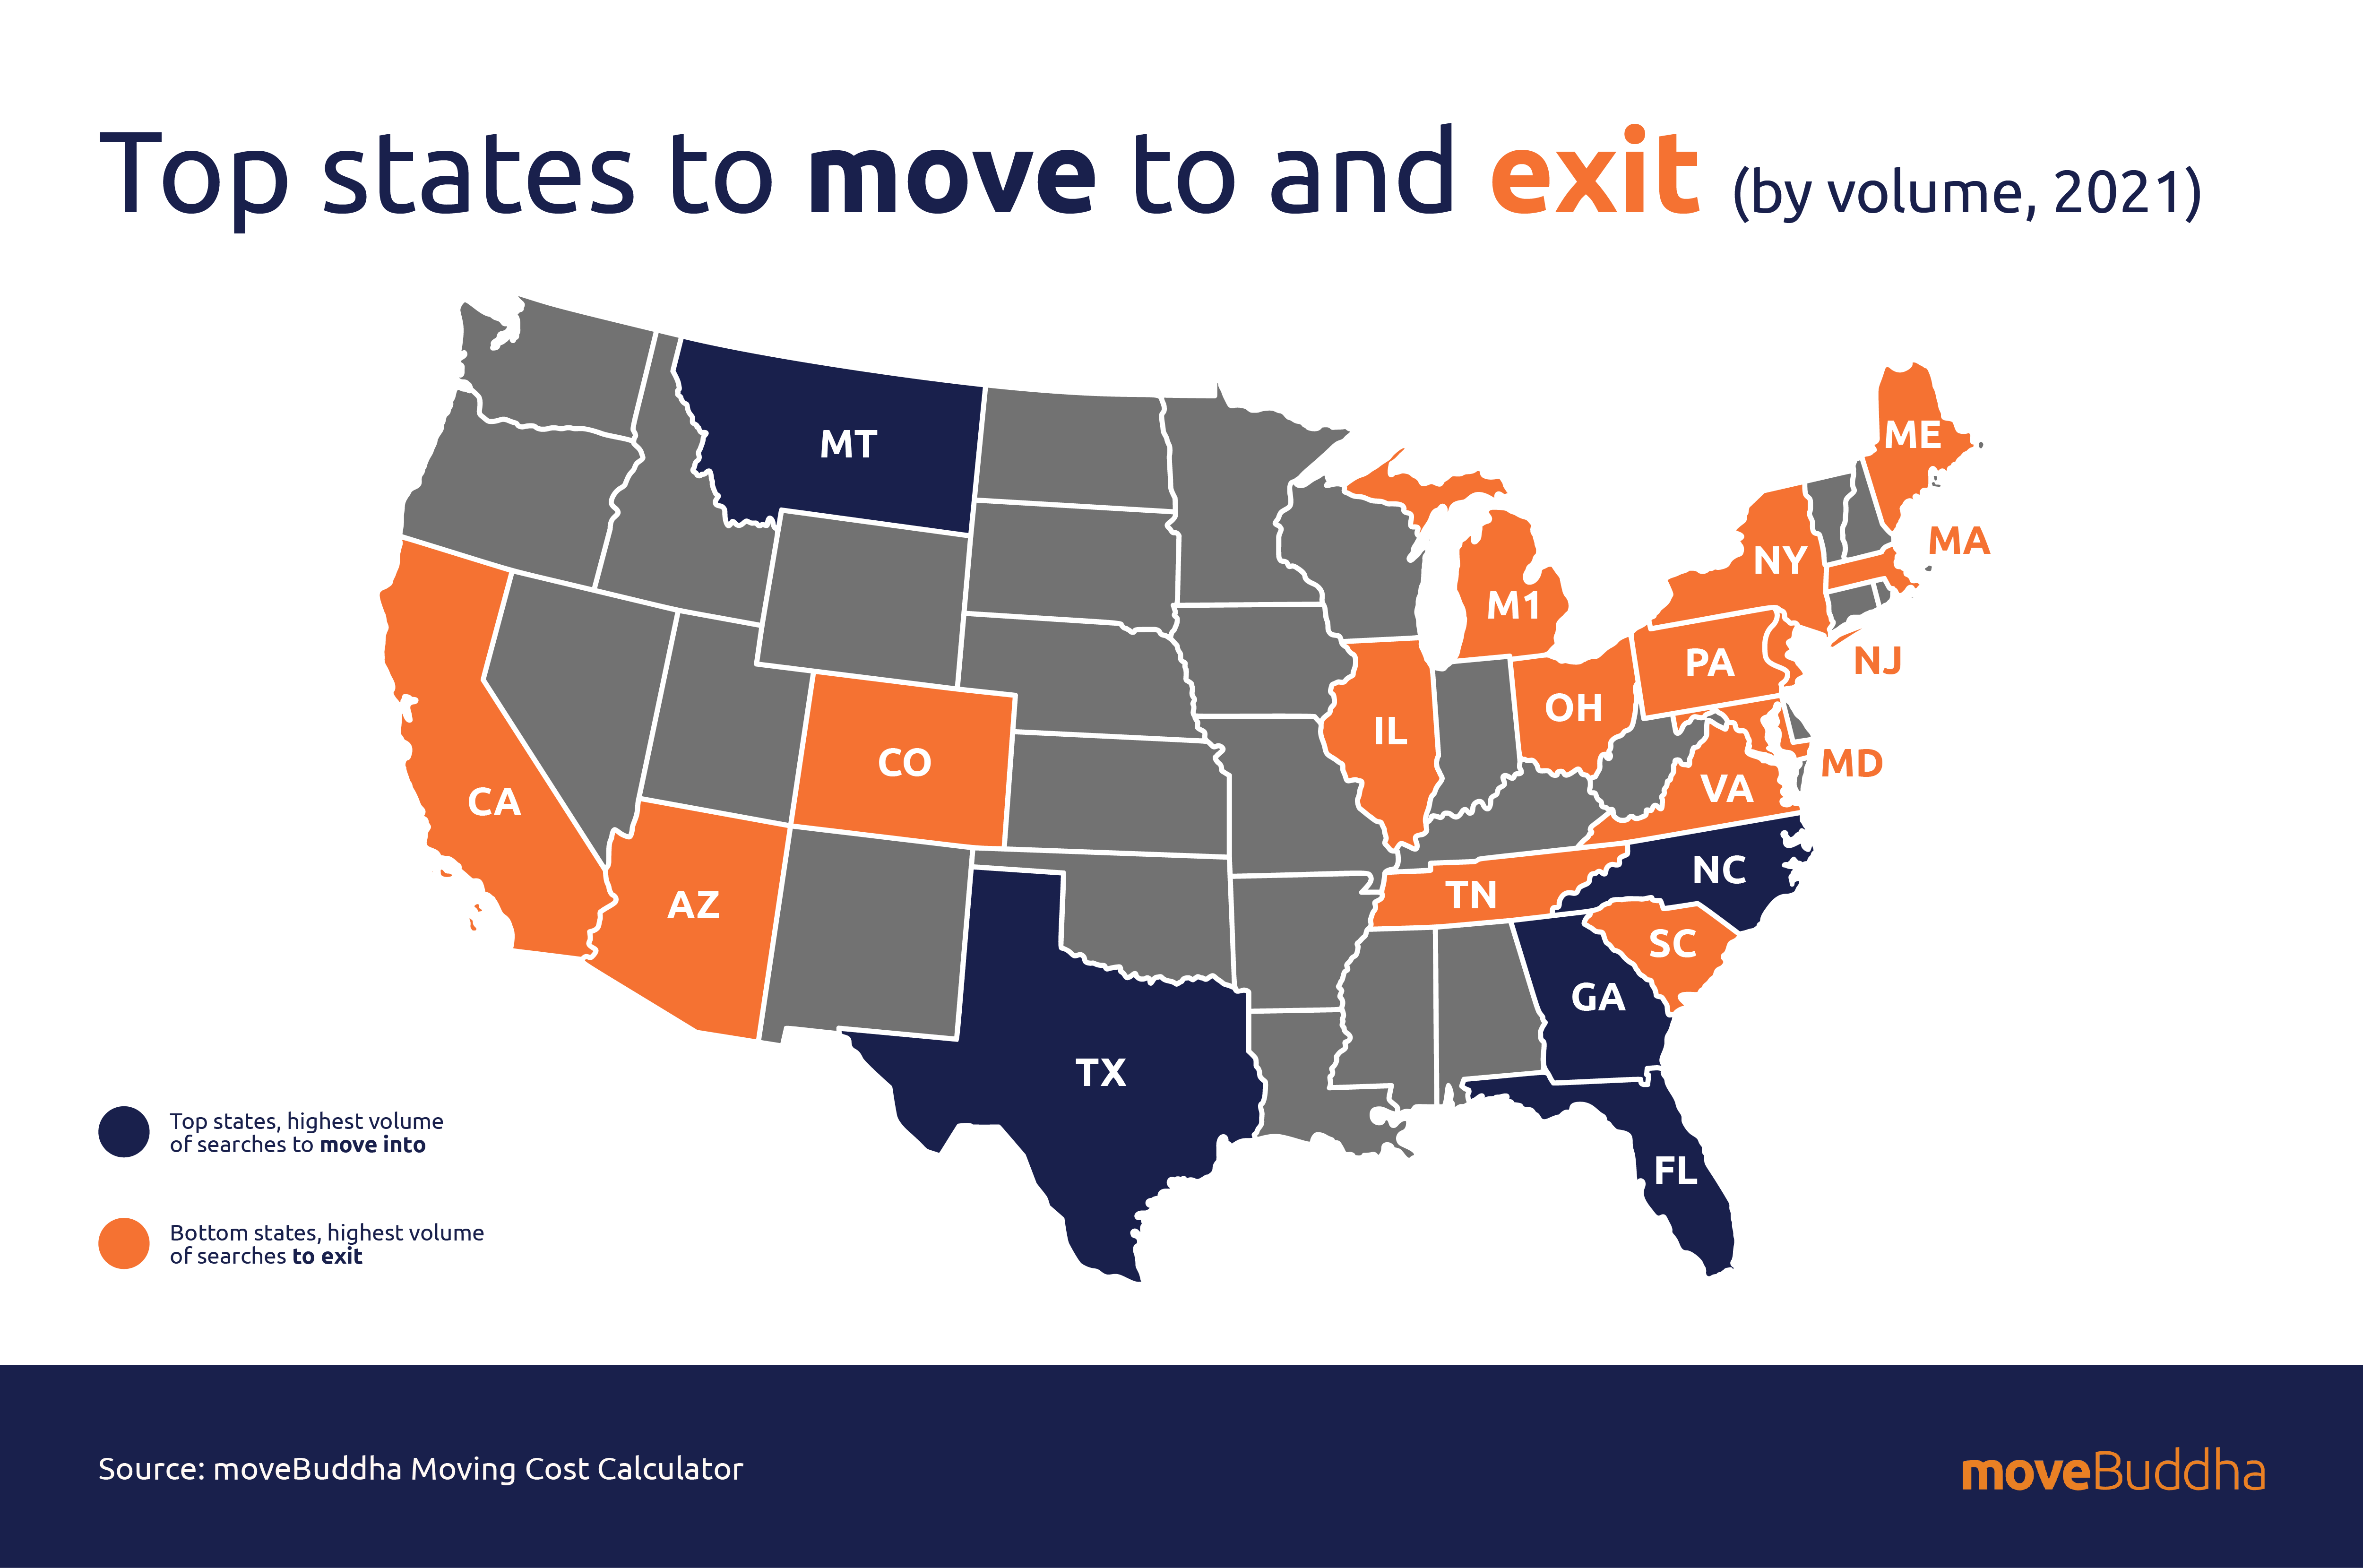
- The states with the most moves either in or out are often the largest. In 2021, when looking at the sheer volume of moves, Florida, Texas, and North Carolina were the most popular. Here are the top and bottom 10 states that stood out as winners and losers for state-to-state moves were: [6]
Which states received the highest proportion of moves in vs. out?
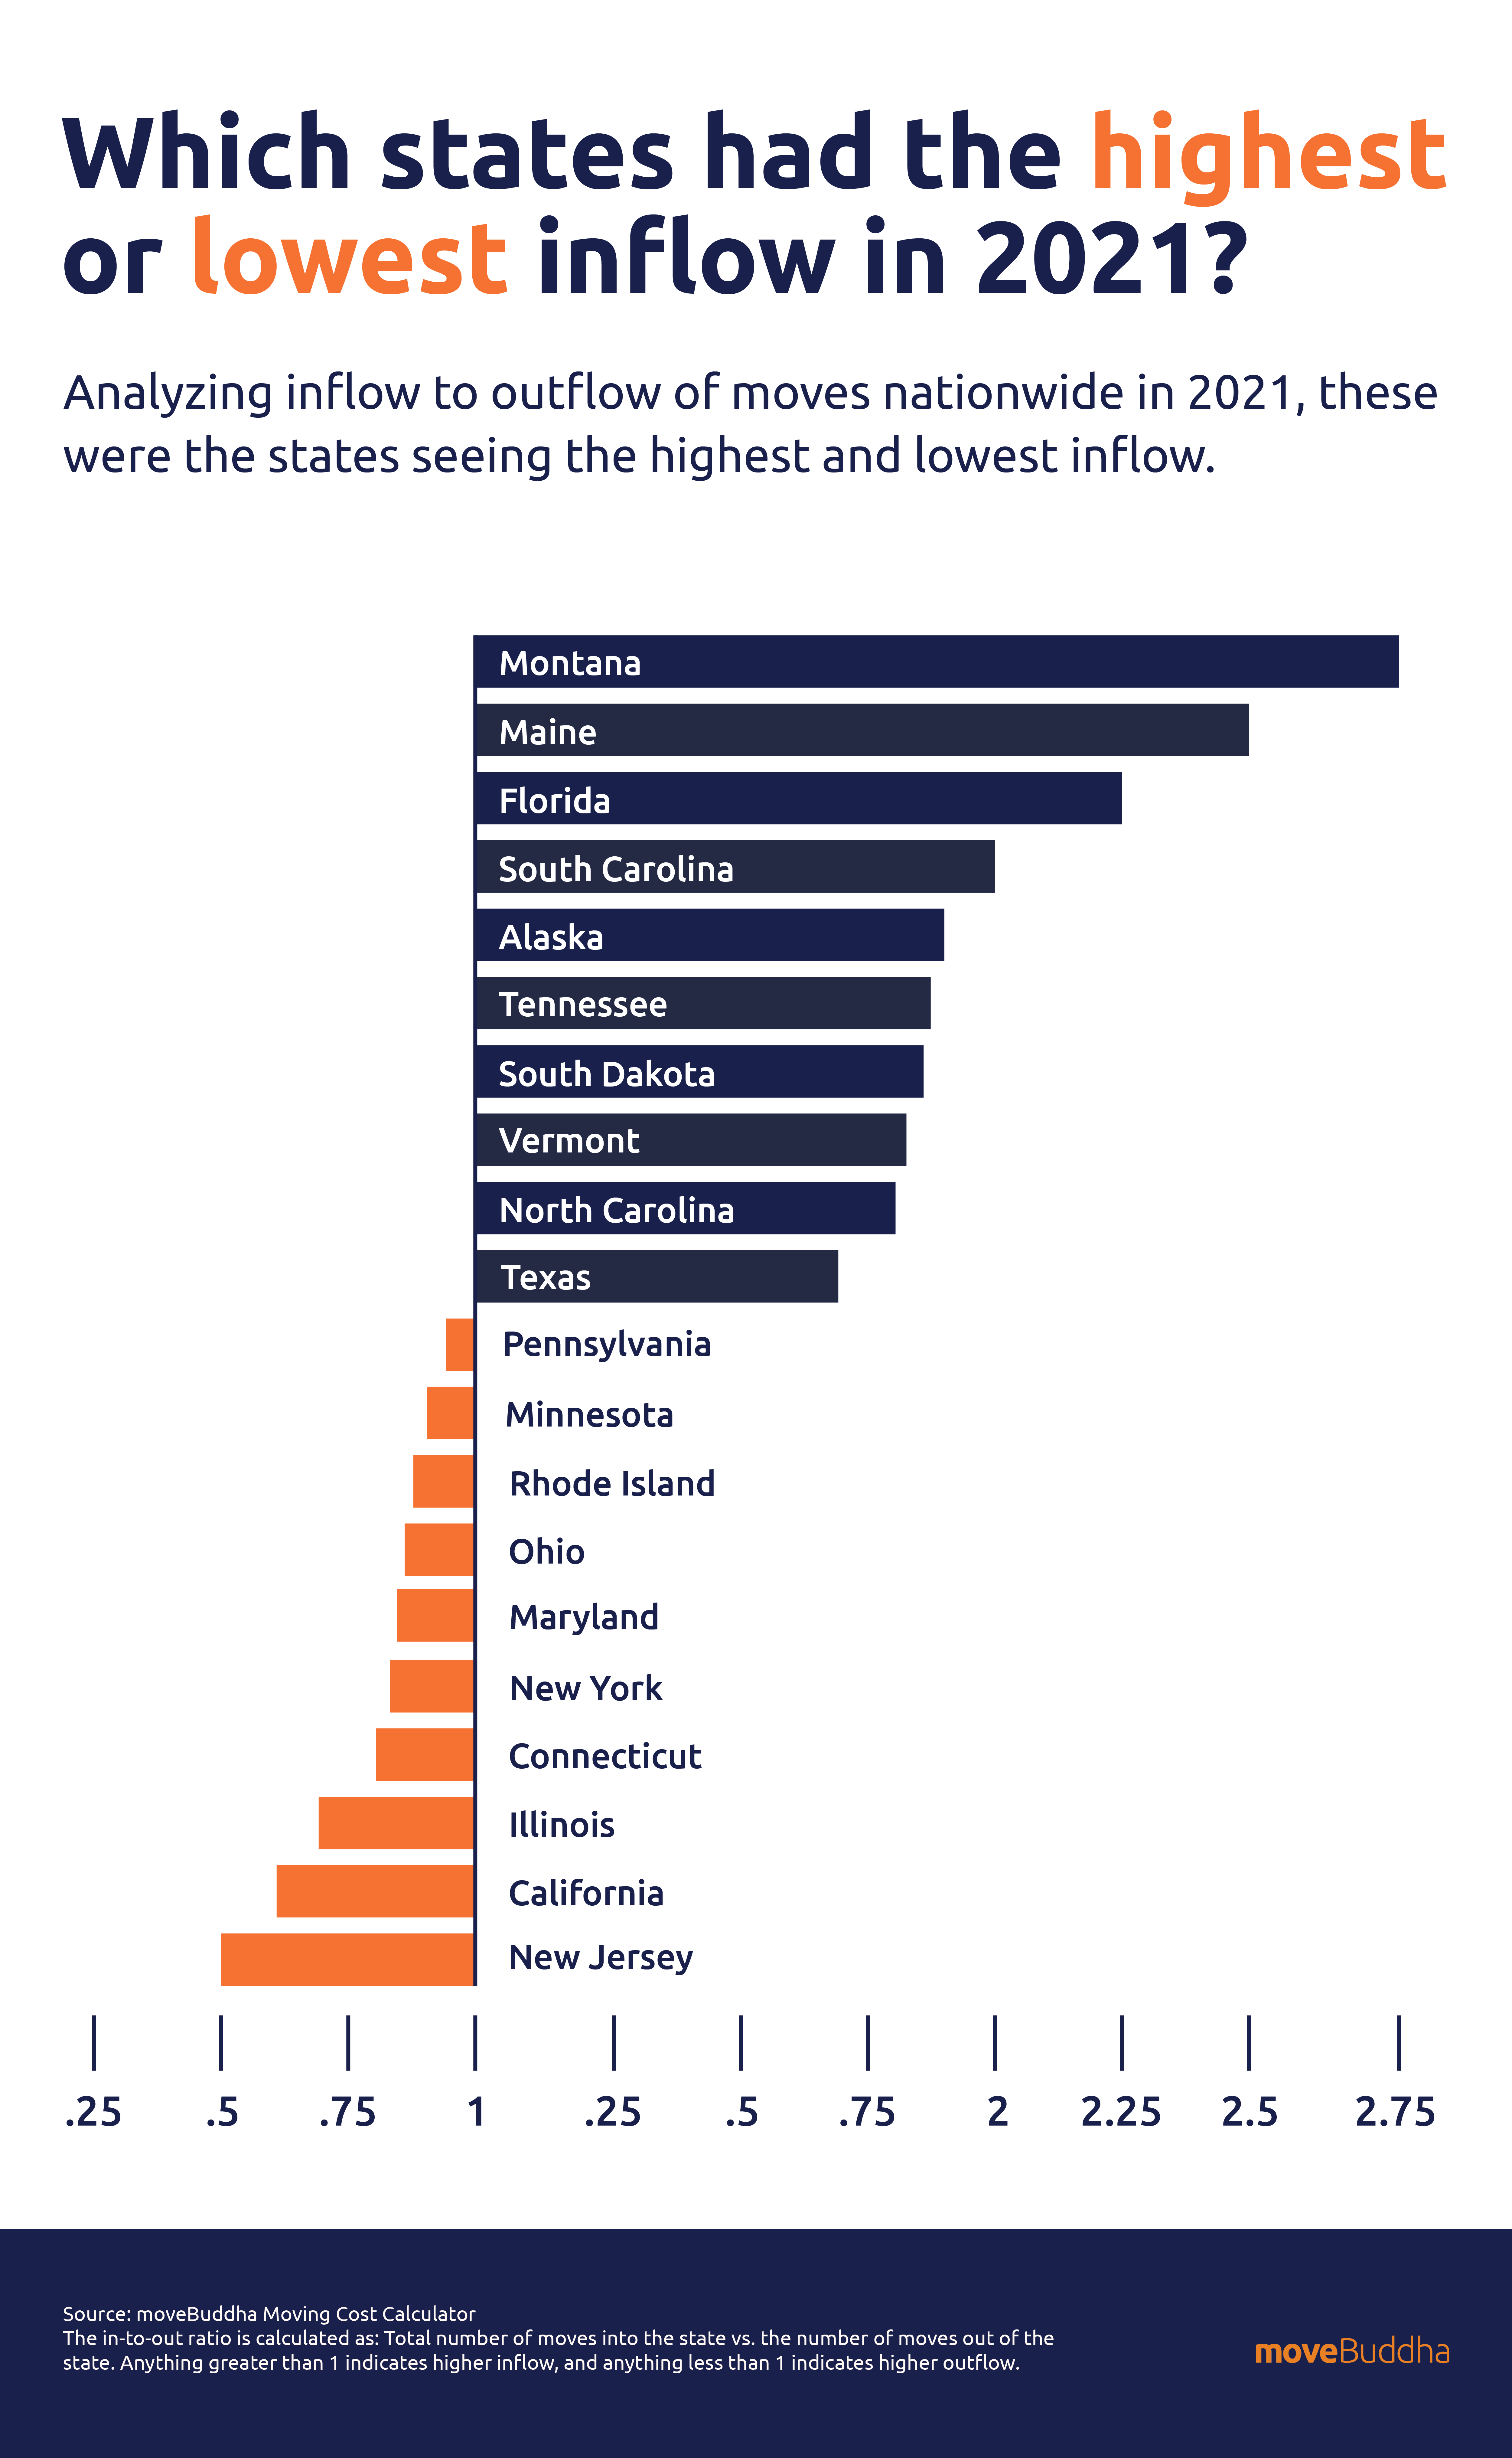
When we look more specifically at the comparison of moves in compared to moves out of each state — the “in-to-out ratio” — we can see which states are gaining the most residents while retaining their existing population, or the inverse. [8]
- Which states are earning higher proportions of inflow? Montana, Maine, and Florida stood out as especially popular in 2021. The 10 states receiving the highest ratio of inflow in 2021 were:
| Rank | State | In-to-out Ratio |
| 1 | Montana | 2.74 |
| 2 | Maine | 2.24 |
| 3 | Florida | 2.1 |
| 4 | South Carolina | 2.08 |
| 5 | Alaska | 2.06 |
| 6 | Tennessee | 1.9 |
| 7 | South Dakota | 1.89 |
| 8 | Vermont | 1.82 |
| 9 | North Carolina | 1.78 |
| 10 | Texas | 1.68 |
- And these are the 10 states that are seeing proportionally higher outflow according to the in-to-out ratio in 2021:
| Rank | State | In-to-out Ratio |
| 1 | New Jersey | 0.46 |
| 2 | California | 0.48 |
| 3 | Illinois | 0.58 |
| 4 | Connecticut | 0.65 |
| 5 | New York | 0.66 |
| 6 | Maryland | 0.67 |
| 7 | Ohio | 0.7 |
| 8 | Rhode Island | 0.71 |
| 9 | Minnesota | 0.73 |
| 10 | Pennsylvania | 0.74 |
Which states are more popular or less popular from year to year?
According to our Migration Report, we examined which states were increasingly popular as we moved from 2020 into 2021.[8]
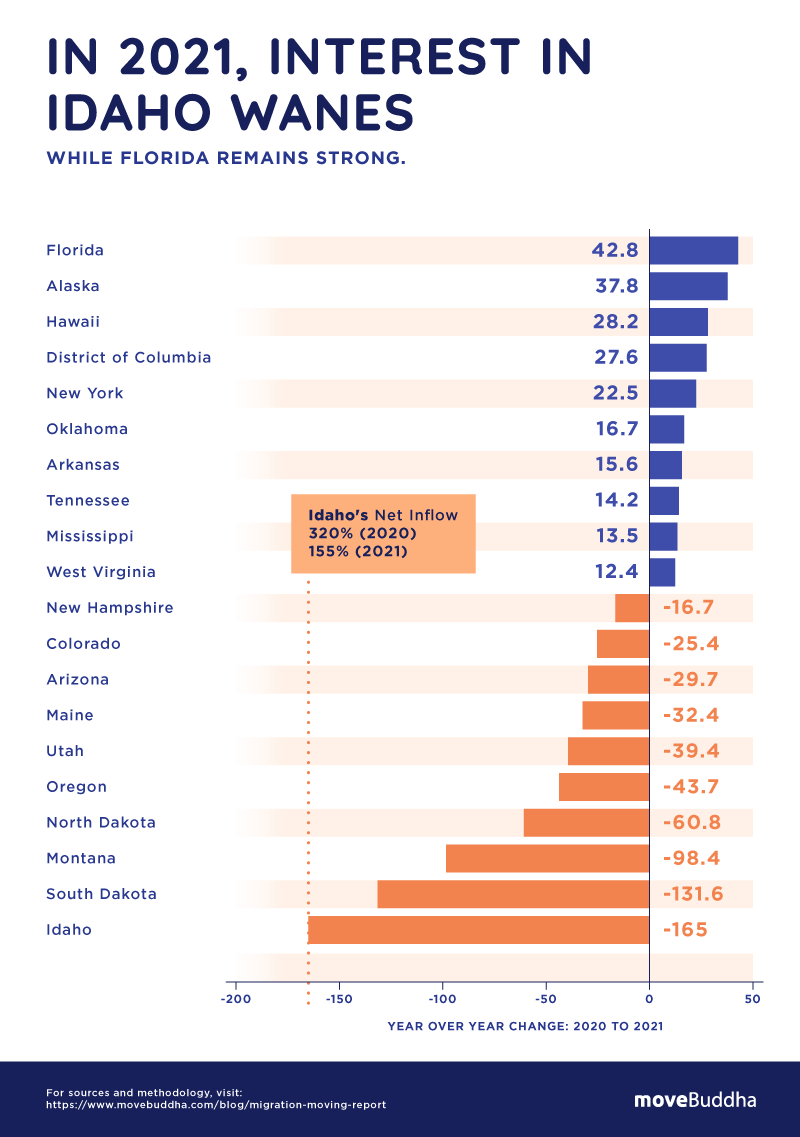
- The states with the highest percentage change of inbound to outbound moves between 2020 and 2021 were:
- Florida: 42.8
- Alaska: 37.8
- Hawaii: 28.2
- District of Columbia: 27.6
- New York: 22.5
- Oklahoma: 16.7
- Arkansas: 15.6
- Tennessee: 14.2
- Mississippi: 13.5
- West Virginia: 12.4
- And here are the states that lost popularity, with the lowest percentage change of inbound to outbound moves from 2020 to 2021:
- Idaho: -165
- South Dakota: -131.6
- Montana: -98.4
- North Dakota: -60.8
- Oregon: -43.7
- Utah: -39.4
- Maine: -32.4
- Arizona: -29.7
- Colorado: -25.4
- New Hampshire: -16.7
State migrations
At moveBuddha, we’ve done a lot of research on the states that are seeing the most migration traffic. Here we share some key highlights from our reporting and analysis of the most popular states to move to and from.
- From 2010 to 2020, Texas grew by 4 million — more than any other state.
- Nearly 1 in 4 moves into Texas in 2022 are from California.
- 17.4% of 2022 inflow into the state is from Californians moving to AZ.
Tennessee: Follow Me to Tennessee
- Moves into the state are coming from Californians (22%) who dominate 2022 inflow into Tennessee, followed by Florida (8%), Texas (5%), Illinois (5%), and Colorado (4%).
- East Tennessee is especially popular to move to in 2022, top cities are Chattanooga and Johnson City.
New Jersey: Garden State Exits
- 2022 data for state-to-state moves shows that for every 34 moves into New Jersey, there are 100 out – greater outbound traffic than any other state.
- 1 in 4 searches for outbound moves is for Florida cities. The top 3 states for New Jerseyans headed out in 2022 are Florida, California, and Texas.
California: Golden State Exodus
- 2022 data for state-to-state moves shows that for every 37 moves into California, there are 100 out.
- The top states welcoming Californians in 2022 are Texas, Florida, and Washington.
- The two most searched routes out of California are from San Francisco and Los Angeles, both destined for New York City.
North Carolina: Carolina in Our Minds
- California, Florida, and New York are fueling growth in 2022, together they comprise 30% of searches for moves to NC.
- Raleigh and Charlotte metropolitan-area cities are especially popular for 2022 inbound moves.
- 2022 data for state-to-state moves shows that for every 42 moves into Illinois there are 100 out, the third-highest outbound interest in the US this year.
- Top states for Illinoisans headed out in 2022: Florida (15.31%), Texas (11.49%), and California (10.18%)
Who is moving
- The mean age of people moving in 2021 was 36.5, while 62% of households had at least one member under the age of 18. [9]
- Who’s moving more, renters or homeowners? Renters move quite a bit more than homeowners, though both sets of movers are on the decline:
- What size households do people move most? Most moves are between one and three bedrooms. Here’s the breakdown of household sizes as percentages of the total number of moves in 2021 and 2020: [12]
Why people move
- According to a recent report by Porch: [9]
- 64% of movers have experienced a recent major life event, the most common of these are:
- Buying a vehicle (26%)
- Becoming employed (21%)
- Graduating from college/university (13%).
- Upsizing into bigger homes to support growing families is the primary reason why movers move — 35% of them. Other reasons include: being closer to family (28%), moving to a safer home (25%), family size is growing (22%), and relocating for a new job (18%).
- 64% of movers have experienced a recent major life event, the most common of these are:
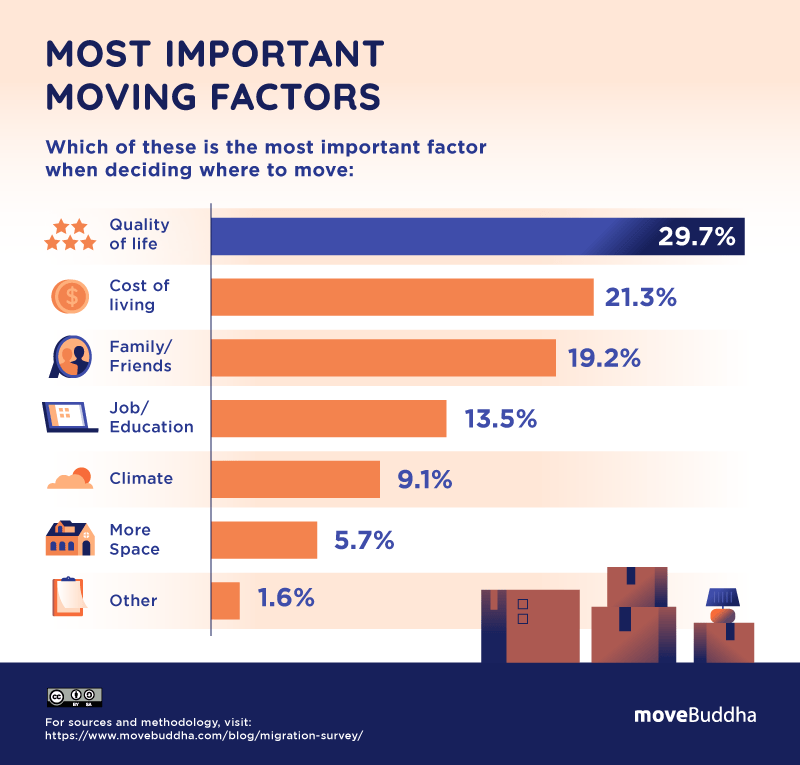
- When deciding where to move, these are the most common factors for U.S.-based respondents: [13]
Millennials on the move (or not)
Since the Great Recession of 2008, millennials — young adults aged 25 to 40 — have felt the full effect of the resulting housing and job crises. This has affected their mobility, with migration rates for this group continuing to stagnate through the pandemic.
- For millennials aged 25-34 local migration dropped from a pre-2010 rate of 14-15% down to 10% in the year before the pandemic, and down to 9.4% in 2021. Likewise, long-distance migration decreased from 6-7% in 2006 to 5.8% in 2021. [14]
- Despite millennials’ propensity to stay put, young adults were the most likely to relocate during the pandemic:[15]
- 32% of Gen Zers (ages 18-24)
- 26% of millennials
- 10% of Gen Xers (ages 41-56)
- 5% of baby boomers (ages 57-75).
- Only 42% of millennials between the ages of 25 and 35 are married and living with their spouse. That’s compared to 82% of members of the Silent Generation who were the same age in 1963. [16]
- 56% of millennials between the ages of 25 and 35 do not have children. [16]
- Millennial homeownership rates are just 48%, much less than their older counterparts at more than 20% lower than the rate for Gen X and nearly 30% less than for Baby Boomers. [17]
- 80% of millennials say they would be willing to take a pay cut to move to their dream location. [18]
- Considering all of these factors, why are millennials moving less than previous generations? Economists think there are a few factors, but the biggest ones are that there are less job market opportunities for this generation, plus millennials largely can’t afford to buy homes, which makes them less motivated to move. [16]
Moving industry: The economics
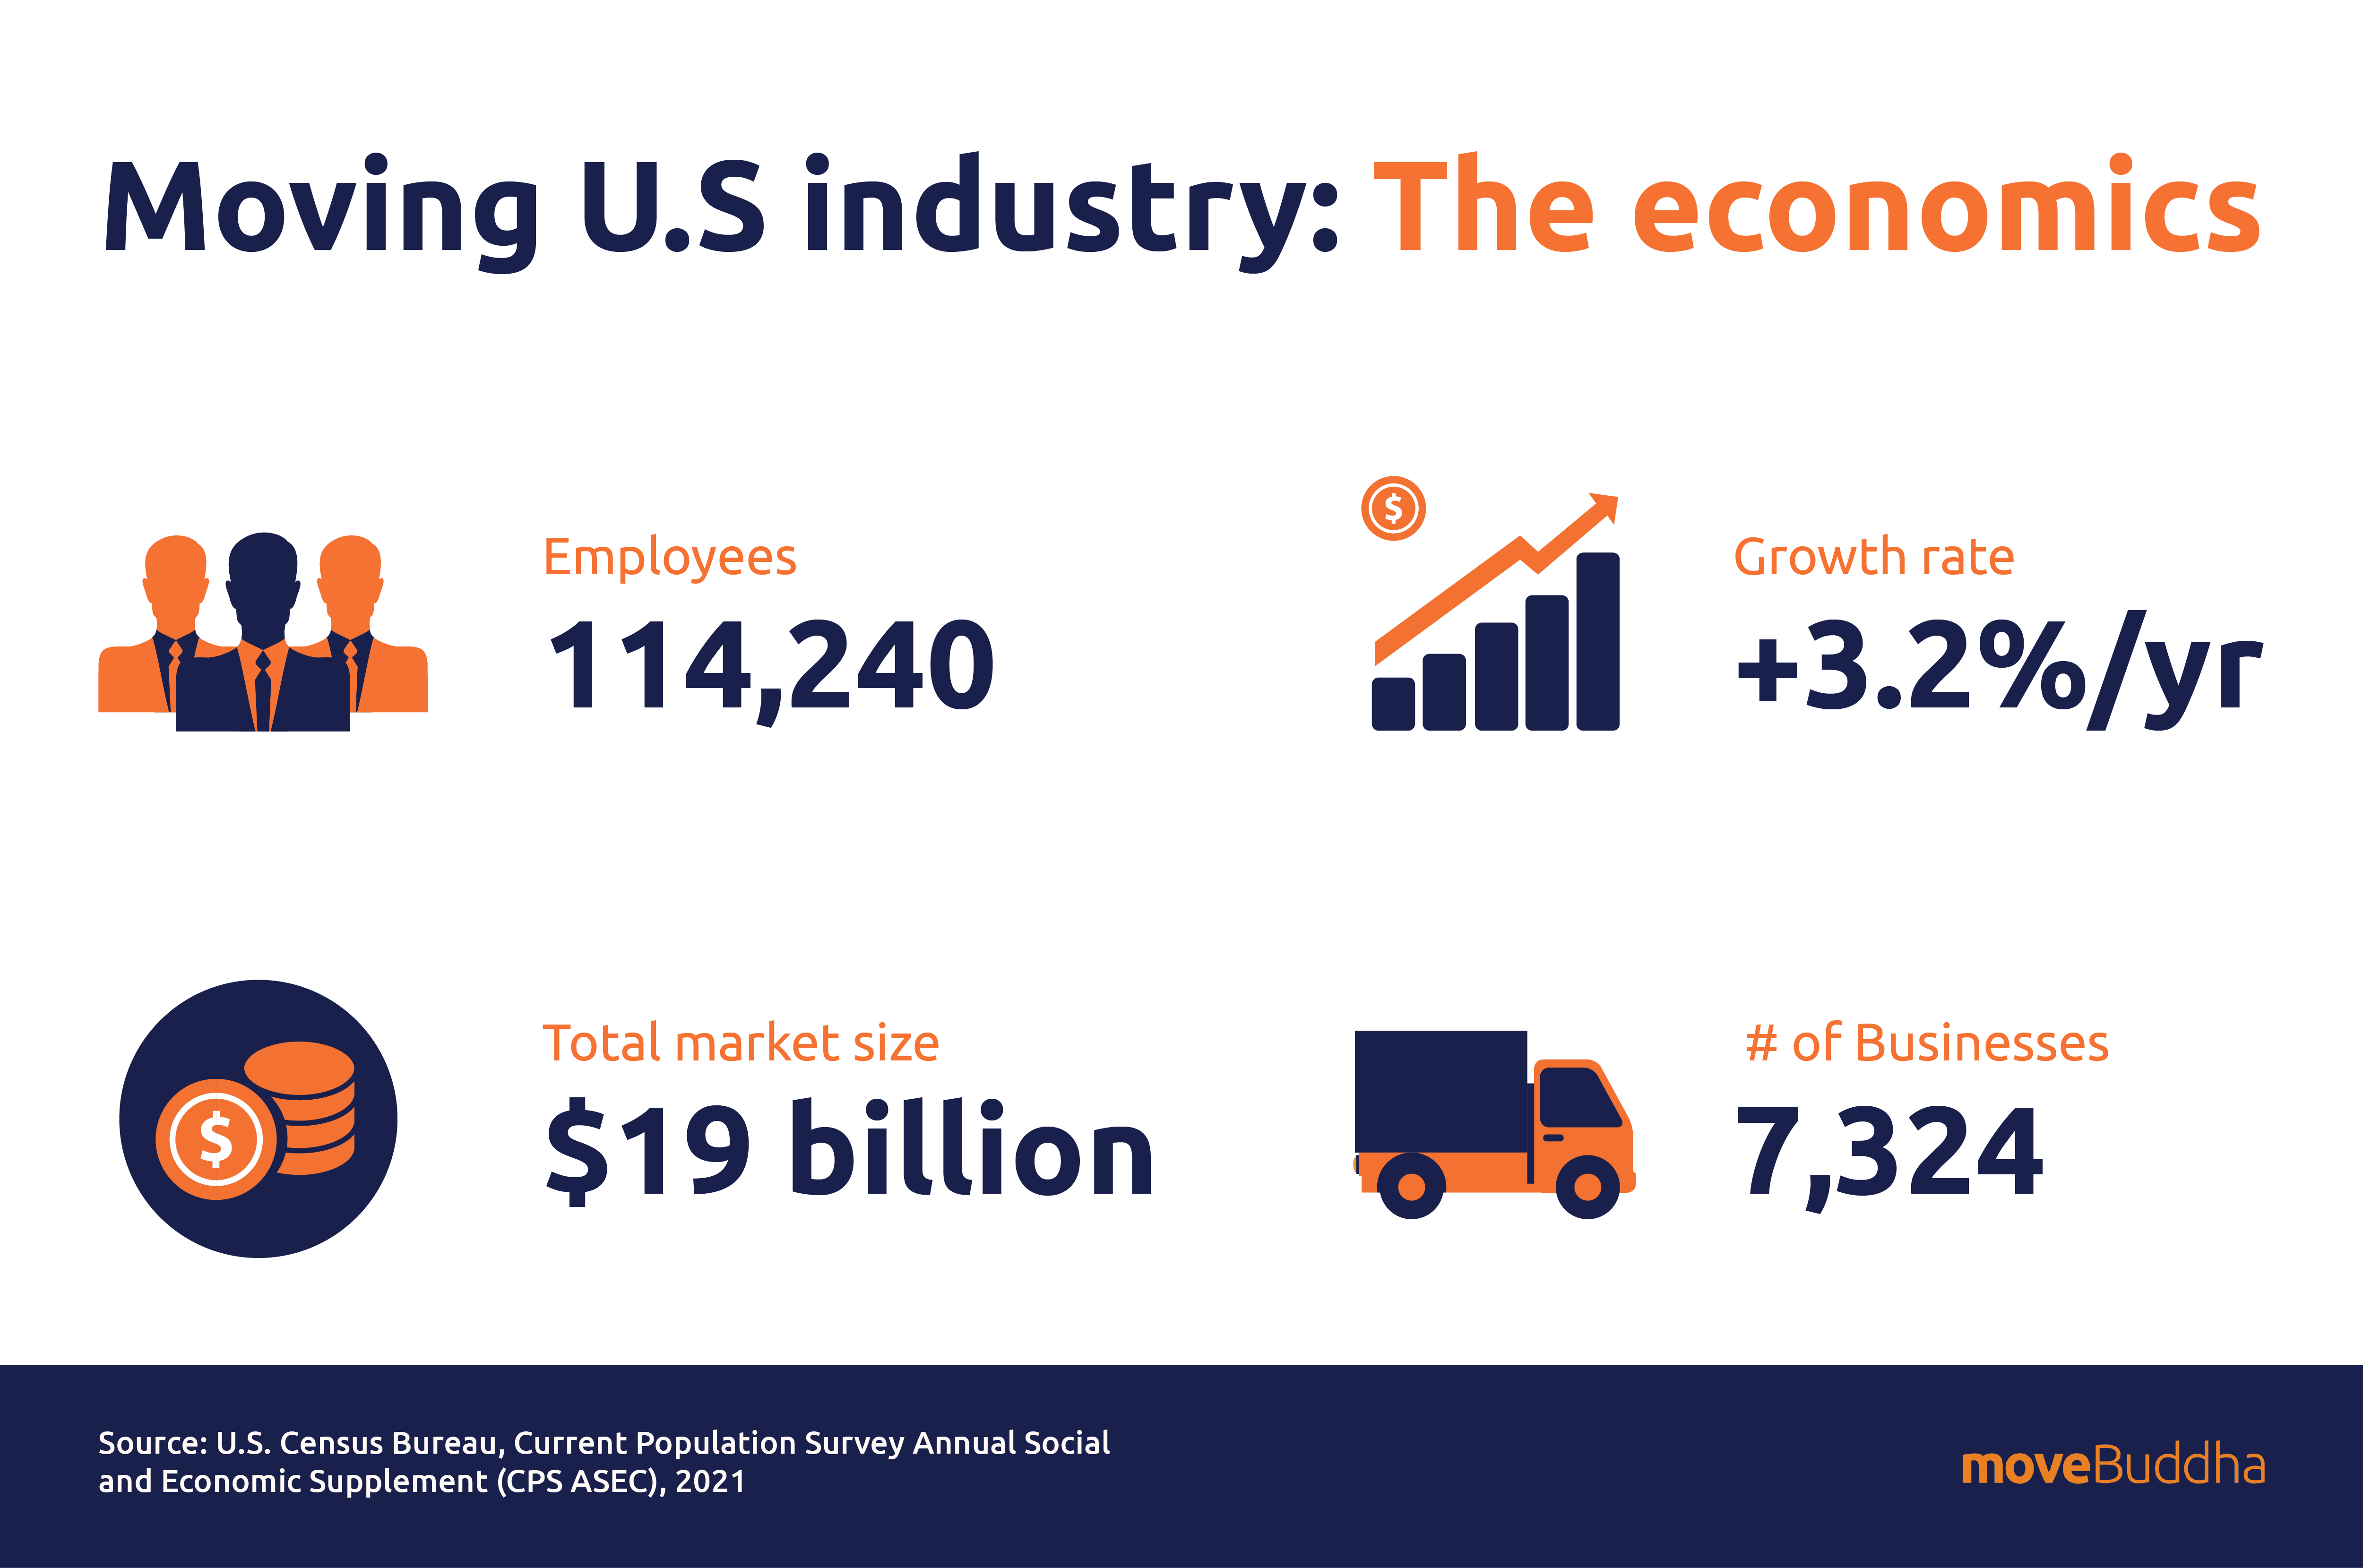
- Moving companies are officially in the Moving Services Industry. The Moving services industry is the 18th largest category of the Transportation and Warehousing Industry.
- The U.S. moving services industry employs 114,240 people for a total market size of $19 billion. [19]
- Over the past 3 years, the industry has grown at an annual rate of 3.2%. [20]
- The moving services market share is expected to increase by $1.95 billion from 2021 to 2026, and the market’s growth momentum will accelerate at a CAGR of 2.04%. [21]
- Because the moving industry is predominantly composed of small businesses employing fewer than five employees, there are a lot of moving companies out there — currently 7,324 businesses. [20]
- In 2021, the moving and storage industry directly supported 186,382 jobs, in addition to indirectly supporting 121,968 jobs and inducing 173,420 for a total impact of 481,770 jobs. It paid $12.8 billion in wages. [22]
- The moving industry generated $32.2 billion in direct economic activity and a total sum of $92.2 billion in economic activity including indirect and induced activity. [22]
- Closely related to the moving industry is the self-storage industry, which generates around $39.5 billion in revenue each year in the U.S. [23]
- 9.4% of American households rent storage units. [23]
- There are nearly as many storage facilities (50,523) in the U.S. as there is a combined count of Starbucks, McDonald’s, Dunkin’ Donuts, Pizza Hut, and Wendy’s restaurants (50,693). [23]
How much waste does moving create?
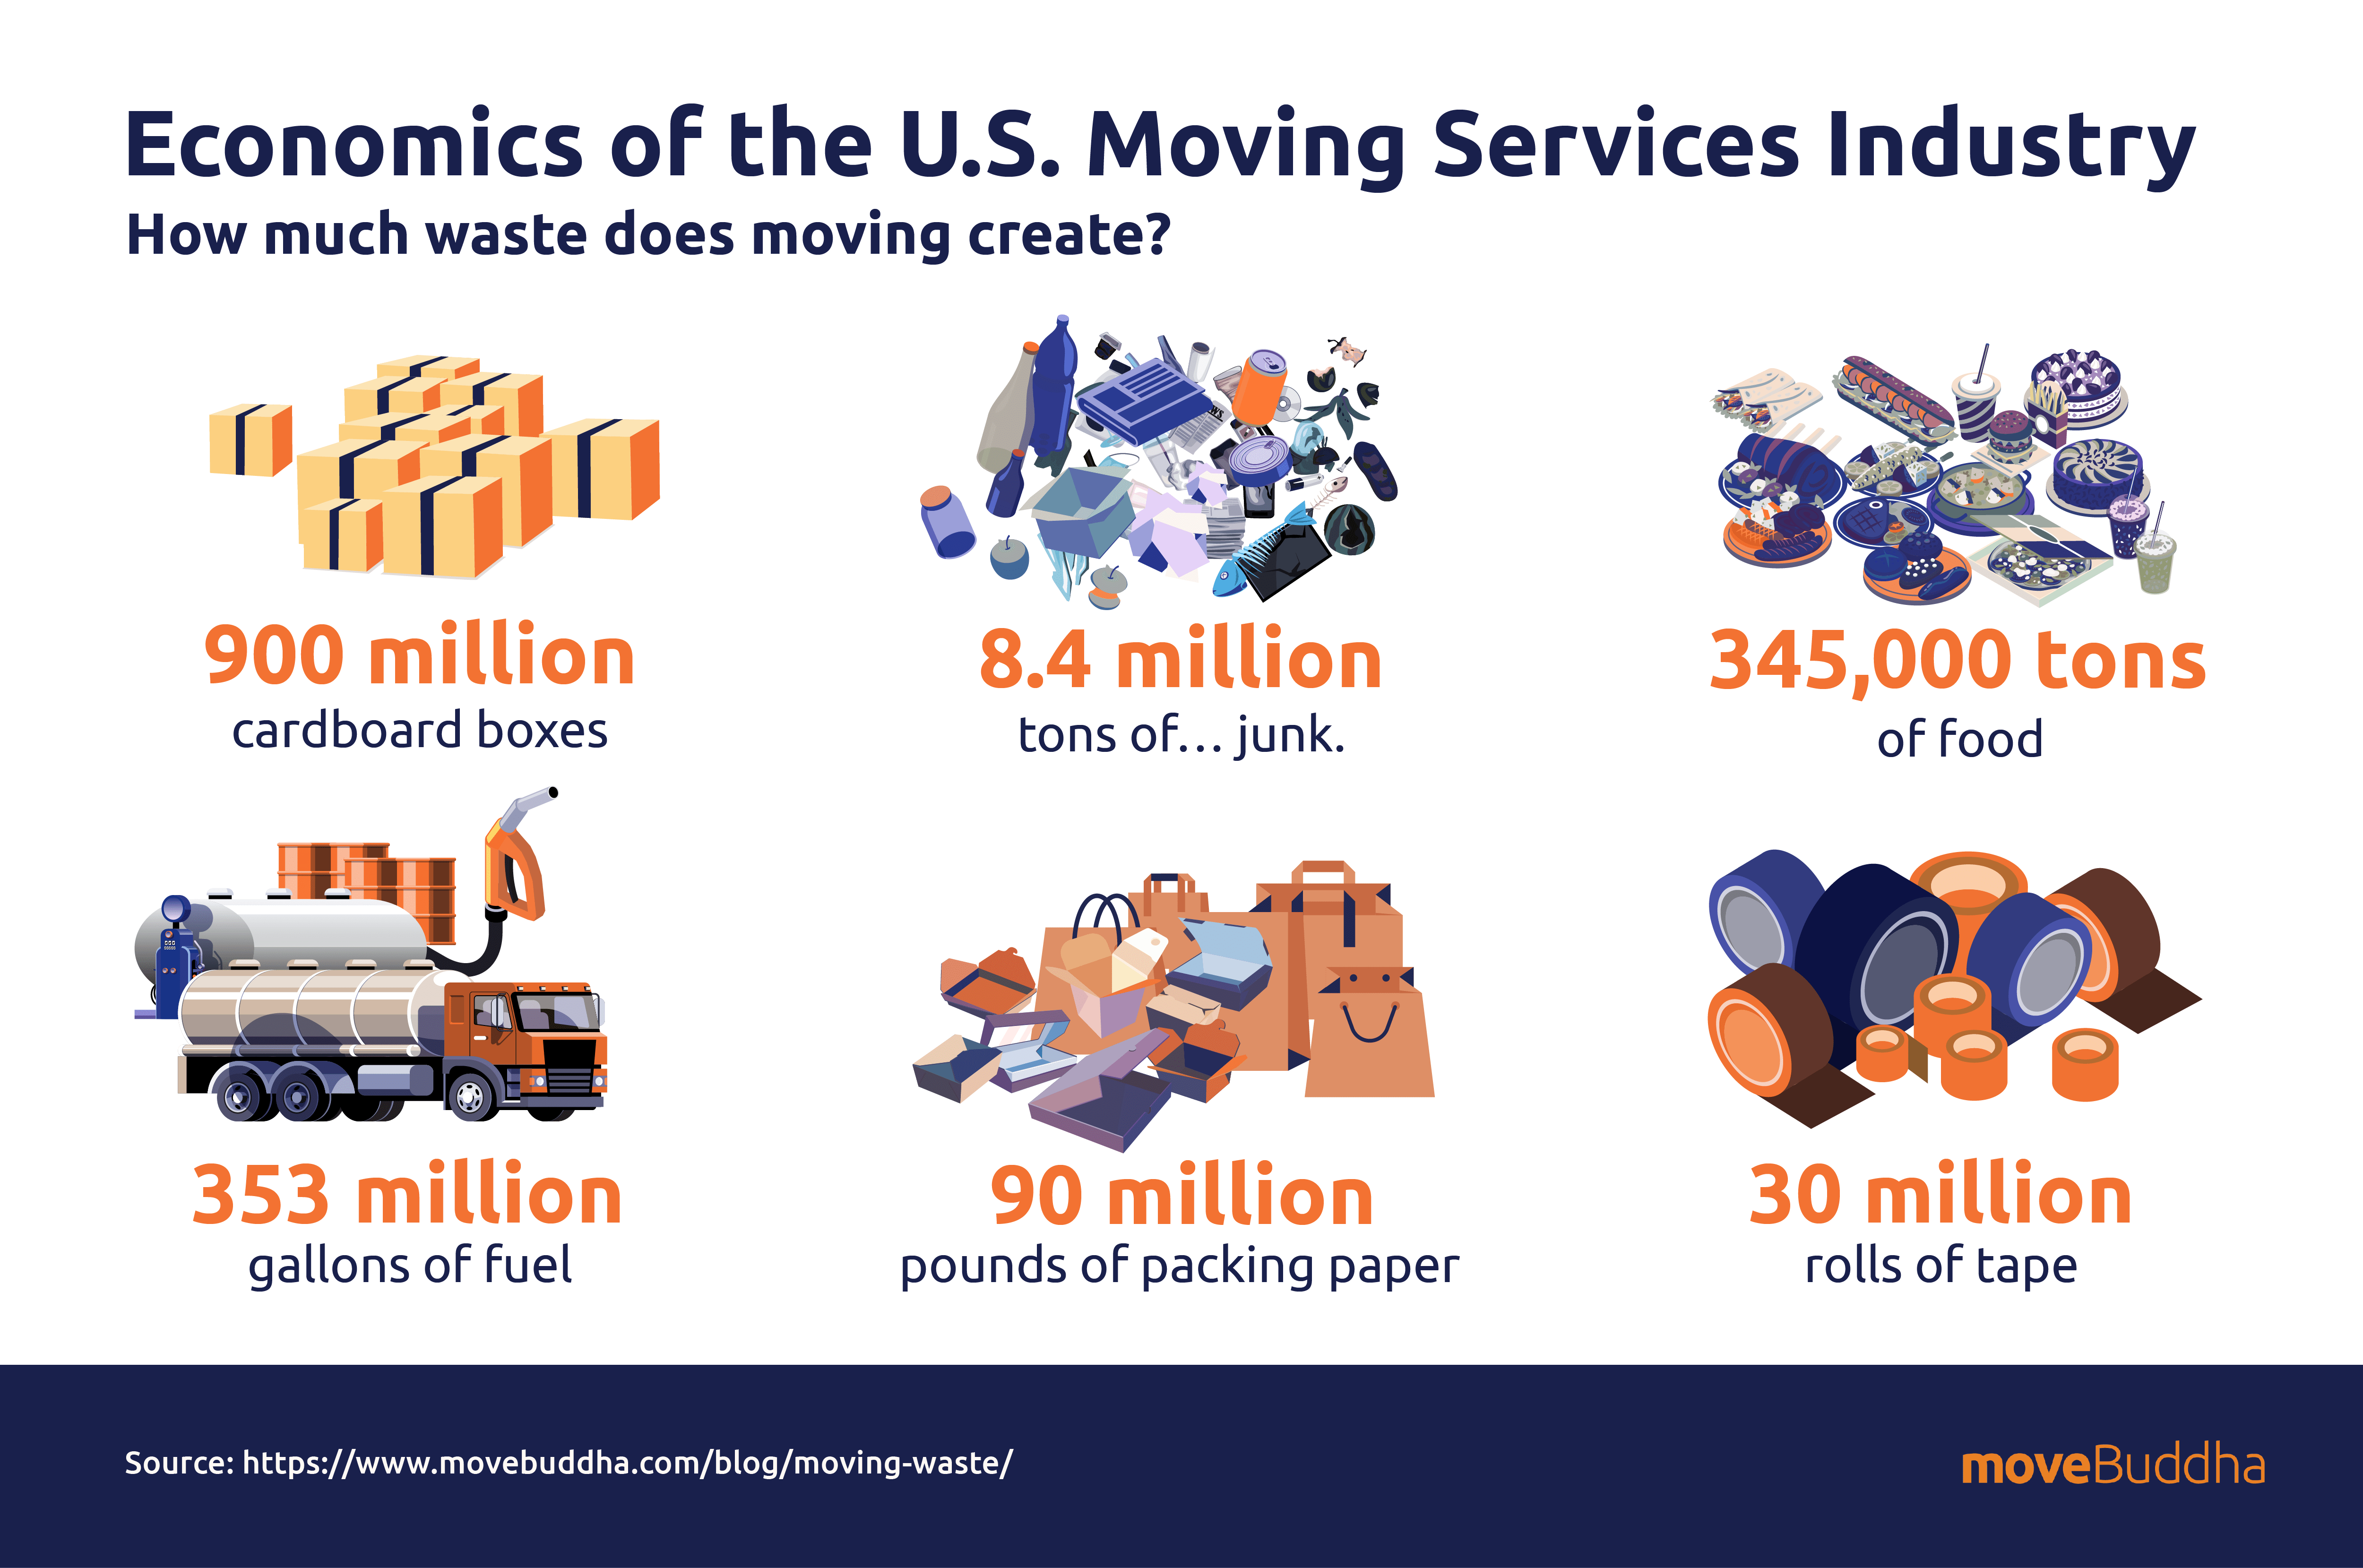
Moving creates more waste than most of us realize. Understanding this is the first step to doing something about it in your next move.
- This is how much estimated waste is generated in moves across the country each year: [24]
- 900 million cardboard boxes
- 8.4 million tons of… junk. This includes all of the things sitting in cabinets, drawers, and garages that get thrown out.
- 345,000 tons of food
- 353 million gallons of fuel
- 90 million pounds of packing paper
- 30 million rolls of tape
How the pandemic affected the moving industry
When the COVID-19 pandemic first ripped through the nation, home and work lives were upended. The advent of more flexible working arrangements and the desire to be closer to family meant that many people chose to relocate either permanently or temporarily.
- With this increased need for relocation services, moving businesses struggled in 2021 to meet demand in an economy plagued by worker shortages, rising fuel costs, and health concerns: [25]
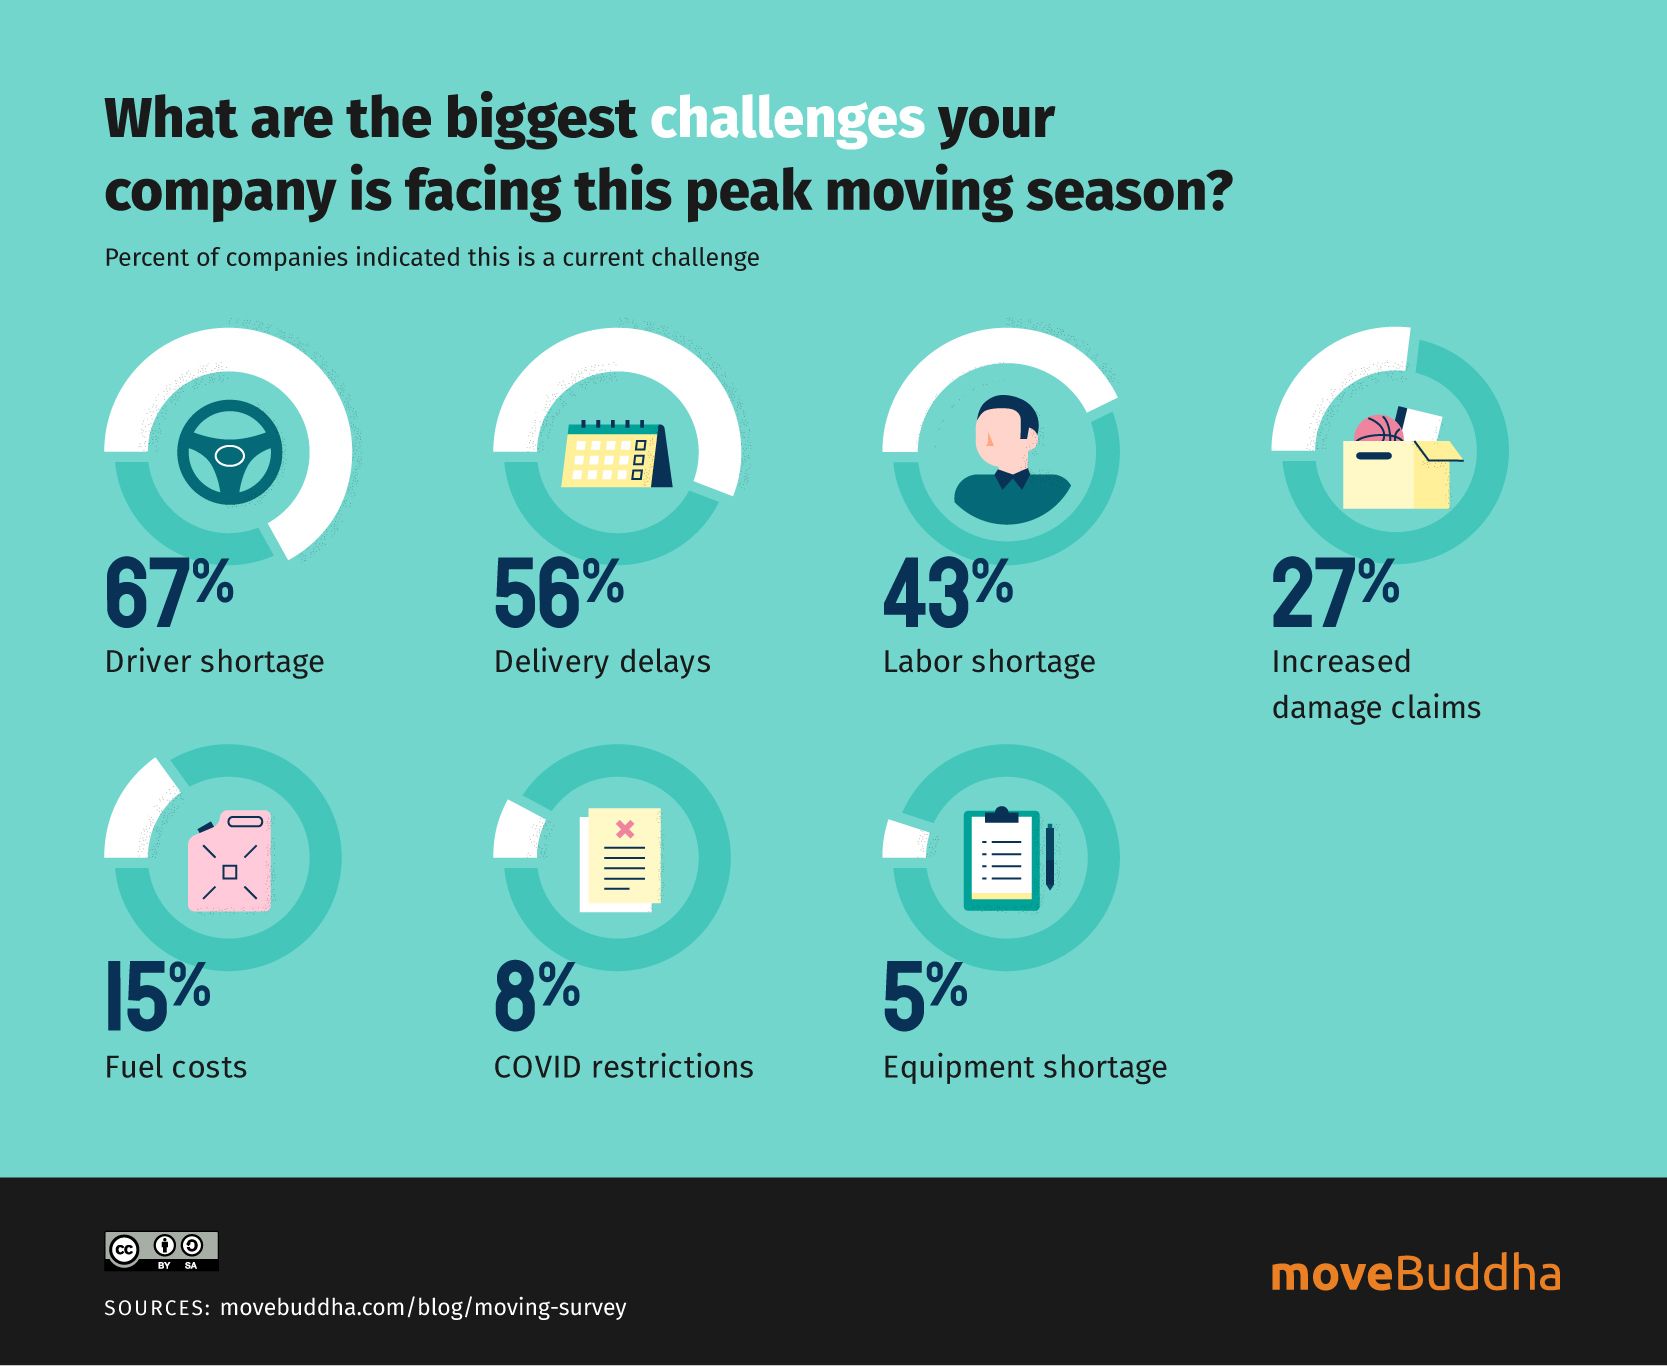
- 67% of moving companies reported driver shortages, which many attribute at least partially to pandemic-related job loss.
- 71% of moving companies reported experiencing delays in 2021 that exceed what is normal for the peak moving season.
- Nearly half of all moving companies were booked out at least three weeks farther than in previous seasons.
- Customer complaints about cancellations rose 250% in 2021 compared with 2019.
- Nearly 40% of the reported moves in 2021 were influenced by either remote work policy or COVID-19.
Moving trends, moving forward
Where are we now? What’s next?
While it’s difficult to project what the long-term effects of the pandemic will be, it’s likely that many of the trends that started with or were exacerbated by COVID-19 will continue into next year and beyond.
If there’s one thing that seems certain, it’s that demand for relocating services will remain high considering that:
- 68% of people who have moved in the past 12 months say that moving during the pandemic was more difficult than moving before. Yet, 59% report that they would likely move again during the pandemic. [9]
- 56% of renters are planning post-pandemic moves, with as many as 60% saying that in the next three years, they hope to stop renting and own a home.[26]
Some of the major moving industry trends we’ve seen over the past couple of years will likely carry on. For instance, the increase in temporary moves and an exodus from large cities and into suburban areas. These types of moves will continue in part due to people seeking more affordable housing as prices continue to trend up. And in part thanks to many jobs transitioning to remote or more flexible work-from-home policies, allowing employees more options to choose where they would like to live.
Beyond economic considerations, we’ve found that 1 in 3 respondents indicated that the most important factor for people considering a move in 2022 is improvements in quality of life. [13]
With more people on the move in pursuit of the good life, there is reason to hope that as households strive to improve their social and economic well-being, this prosperity will trickle down into the communities they come to call home.
Sources:-
1. U.S. Census Bureau, “Calculating Migration Expectancy Using ACS Data”
2. U.S. Census Bureau, “U.S. Migration Continued to Decline From 2020 to 2021”
3. U.S. Census Bureau, “Annual Social and Economic Supplements”
4. NY Times, Frozen in Place: Americans Are Moving at the Lowest Rate on Record
5. moveBuddha, Moving Cost Calculator
6. moveBuddha, “moveBuddha 2021 Moving Statistics”
7. U.S. Census Bureau, “New Vintage 2021 Population Estimates Available for the Nation, States and Puerto Rico”
8. moveBuddha, “State to State Migration Report 2021-2022”
9. Porch, “2021 New Mover Trends Report”
10. Windermere Economics, “Census Analysis of Moving Patterns for U.S. Homeowners and Renters in 2021”
11. Neighbor, “Survey: Over 20% More Americans Plan to Move in 2021 Than in 2020”
12. moveBuddha, “What are the most common sizes of interstate moves?”
13. moveBuddha, “Survey reveals nearly 1 in 5 considering an interstate move in 2022”
14. Brookings, “Despite the pandemic narrative, Americans are moving at historically low rates”
15. Bankrate, “31% of Young Adults Relocated During the Pandemic”
16. Pew Research Center, “Americans are moving at historically low rates, in part because Millennials are staying put”
17. Apartment List, “2022 Millennial Homeownership Report”
18. Graebel, “Millennials See Mobility As Essential For Career Advancement”
19. IBIS World, “Moving Services – US Market Research Report”
20. Kentley Insights, “Moving Services – 2022 U.S. Market Research Report with Updated COVID-19 Forecasts”
21. Technavio, “Moving Services Market in the US by Type and End-user – Forecast and Analysis 2022-2026”
22. American Trucking Associations, “New Report Outlines Economic Impact of Moving and Storage Industry”
23. Neighbor, “Self Storage Industry Statistics (2022)”
24. moveBuddha, “How Much Waste Does Moving Create?”
25. moveBuddha, “Moving Company Pandemic Survey”
26. Entrata, “Renters on the Move: Survey Studies Renter Behaviors During a Landmark Year”
Note: All stats from moveBuddha’s state-based migration reports are linked directly to the corresponding moveBuddha page.
Not what you were looking for?
Check out other categories that can help you find the information you need!
